

A fund’s name can suggest broad exposure, while its factsheet may reveal a narrower investment focus. To understand what you’re considering, learn how to read a fund factsheet by looking beyond its name: review its objective, geographical and sector exposure, asset allocation, returns, benchmark and risk measures. These details help show what the fund holds and how its performance compares with a relevant reference point.
Factsheets can feel dense at first, especially when figures cover different periods or use unfamiliar terms. You don’t need to interpret every number in isolation. This guide shows how to read the key sections, compare performance over time and understand what allocation and benchmark comparisons reveal. It also explains why strong past performance alone doesn’t show whether a fund suits your goals, time horizon or comfort with risk.
Key Takeaways
- Compare annualised and cumulative returns across several time periods to see whether performance has been consistent, not just strong recently.
- Use a relevant benchmark to put a fund’s returns in context, and consider whether it reflects the fund’s investment approach.
- Review the mix of equities, bonds, sectors and regions to understand where the fund’s exposure is concentrated.
- Read risk measures alongside the fund’s investment objective and your time horizon; no single figure tells the whole story.
- Look beyond a fund’s name to its actual holdings and geographical focus before deciding whether it aligns with your portfolio.
Historical and annualised performance
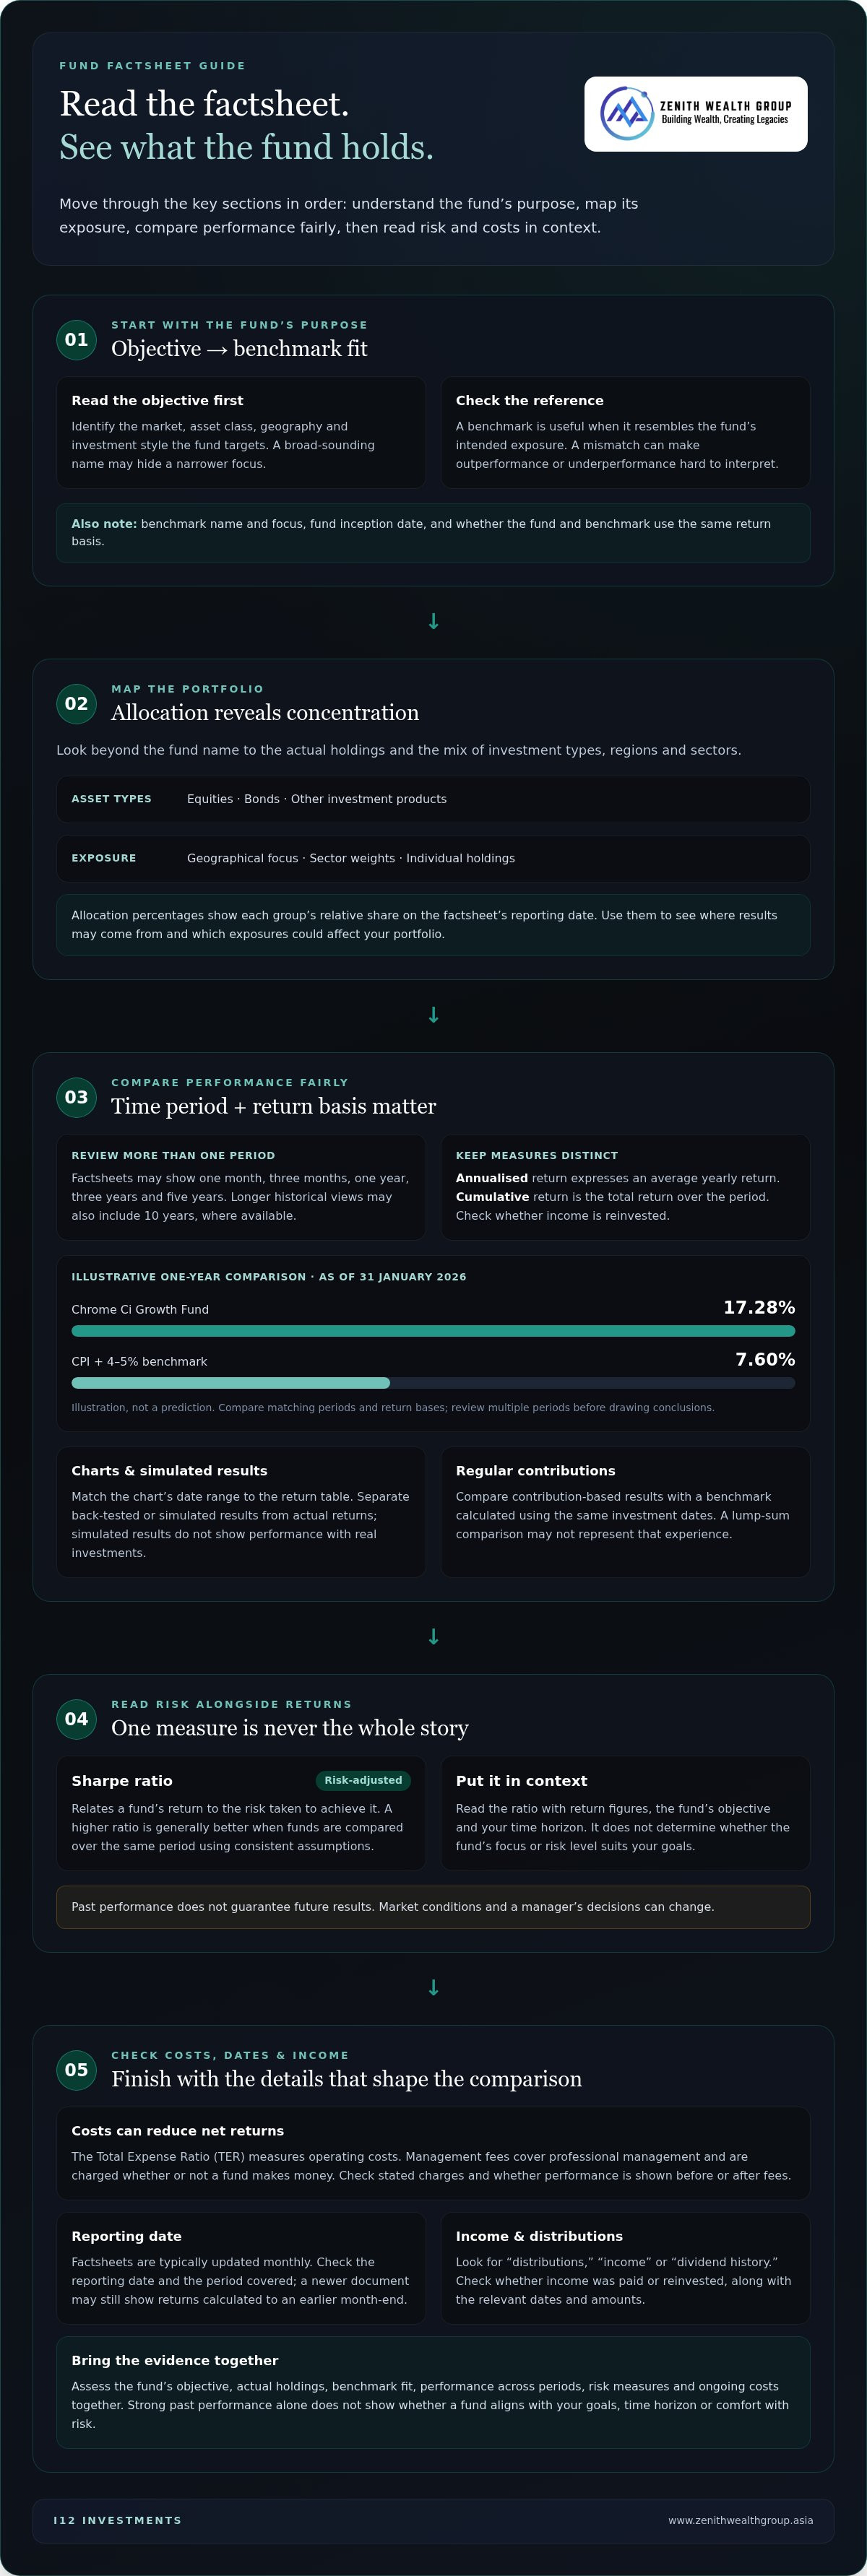
Fund factsheets may show returns over periods such as one month, three months, one year, three years and five years. Compare several periods to see how performance has changed instead of judging a portfolio on a single result.
Historical Performance Across Market Cycles
Historical performance shows how a fund’s returns changed over time, including through different market conditions. This context helps you assess whether results were consistent or concentrated in a brief stretch. Compare one-year, three-year, five-year and 10-year periods where available, and note the dates each figure covers. Past performance doesn’t guarantee future results, because market conditions and a manager’s decisions can change.
Annualised Performance Measures
An annualised return expresses the average yearly return over a specified timeframe. Factsheets may present annualised results for 1-year, 3-year and 5-year periods, making it easier to compare performance across different holding periods. Check the period beside each figure: an annualised return is not the same as the total cumulative return over that period. Also note whether returns include reinvested income.
Sharpe Ratio and Risk-Adjusted Performance
The Sharpe ratio measures risk-adjusted returns by relating a fund’s return to the risk taken to achieve it. A higher ratio is generally better when comparing funds over the same period and using consistent assumptions. Read it alongside the return figures, not as a standalone verdict. A higher ratio doesn’t tell you whether the fund’s investment focus or risk level suits your goals.
Performance Charts and Simulated Returns
A performance chart plots a fund’s value or returns over time, helping you spot rises, falls and periods of uneven results. Match its date range to the return table, then look for sharp changes and prolonged weaker stretches. Newer funds may show back-tested or simulated data rather than a full live track record. Treat these separately from actual historical returns: simulated results don’t show how the fund performed with real investments.
Performance figures need to be considered alongside costs. The Total Expense Ratio (TER) measures a fund’s operating costs, while management fees cover professional management. Management fees are charged whether or not a fund makes money, and fees can reduce net returns over time, especially when returns are low. Compare the stated charges and check whether performance figures are before or after fees. Factsheets are typically updated monthly, so note the reporting date before comparing figures from different documents. Recent returns may cover a different market period from older figures. Assess the manager’s record across cycles, the fund’s risk measures and ongoing costs together.
Benchmark comparisons
A benchmark provides a reference for judging a fund’s results, but it is useful only if it matches the fund’s objective. Compare like with like, using the same period and return basis.
To find dividend or distribution information, look for a section labelled “distributions,” “income” or “dividend history.” It should indicate whether income was paid to investors or reinvested, along with the relevant dates and amounts.
Fund factsheets are typically updated monthly. Check the reporting date and the period covered by the performance figures. A newer document may still show returns calculated to an earlier month-end.
Fund Objectives and Benchmark Selection
A fund’s benchmark is a reference selected to reflect its investment objective and the market or asset class it targets. A comparison is useful only when the reference resembles the fund’s intended exposure. Read the objective first, then check whether the benchmark tracks a similar market, geography and investment style. A mismatch can make outperformance or underperformance difficult to interpret.
For example, don’t judge a fund focused on a particular region as though it invests across every global market. Check the benchmark name, its stated focus and the fund’s inception date. The inception date indicates how much live history is available; a short record offers less evidence across market conditions. Fund size adds context, but a larger fund doesn’t automatically mean better returns. Also compare the basis used for the fund’s returns and benchmark, since costs affect what investors receive.
Benchmark Indices and Fund Comparisons
A benchmark index tracks a defined group of investments and provides a reference for comparing a fund’s returns. Use matching periods and the same return basis, including the treatment of reinvested income where available. This helps separate the fund’s results from broader market movements. For passive funds, low tracking error means returns have closely followed the benchmark.
One reported example shows Chrome Ci Growth Fund returning 17.28% over one year, compared with its CPI + 4-5% benchmark return of 7.60%, as of 31 January 2026. Treat this as an illustration, not a prediction. Check whether comparisons are annualised or cumulative, and review multiple periods before drawing conclusions. For regular contributions, compare the contribution-based result with a benchmark calculated using the same investment dates; a lump-sum benchmark comparison may not represent that experience.
Use the benchmark as a reference, not a verdict on the fund manager’s investment decisions. A difference can reflect the fund’s holdings, costs or investment approach. If the comparison leaves you unsure how a fund fits your wider portfolio, you can discuss your investment goals in the context of investment management.
Why Asset Allocation in a Factsheet Matters?
Asset allocation shows how a fund divides its portfolio among investment types, regions and sectors. Review those weights to understand where results may come from and which exposures could affect your portfolio.
Portfolio Composition and Asset Allocation
A factsheet groups portfolio assets, such as equities, bonds and other investment products, to show its composition. Allocation percentages indicate each group’s relative share on the reporting date. This matters because two funds with similar names can hold different assets and respond differently to changing market conditions.
Start with the largest allocation, then review the smaller positions. A fund holding mostly equities has a different profile from one invested mainly in bonds. Compare the allocation with the fund’s objective and prospectus, which provides more detail about its investment approach. Keep allocation and charges distinct: fees affect net returns, while allocation describes what the fund owns.
Asset Allocation and Diversification
Diversification spreads a portfolio across different assets or exposures, while asset allocation shows how that spread is divided. A long list of holdings can still be concentrated in one asset class, sector or region. Review both the overall allocation and the holdings beneath it.
For example, a fund may hold equities across several companies but remain heavily exposed to one sector. Its company count alone wouldn’t reveal that concentration. Review the top 10 holdings, if shown, and compare them with the broader allocation. Changes in those holdings over time could indicate a shift in the fund’s approach, while overlap with other investments may increase your portfolio’s exposure to the same companies.
Country and Sector Allocation
Country and sector tables show where a fund invests and which industries make up its exposure. These breakdowns matter because a fund labelled “global” may still have substantial exposure to particular countries or sectors. Check each percentage and its reporting date before comparing it with another factsheet.
One example is Chrome Ci Growth Fund, which had local exposure of 58.89% as of 31 January 2026. That figure describes the fund’s country exposure at that date, not a permanent allocation. Compare it with the fund’s stated geographical focus and note whether the factsheet separates domestic holdings from international ones. A sector table can reveal a similar concentration, such as a large relative allocation to financial companies or technology firms.
For a practical review, note the largest asset class, country and sector, then compare each with the fund’s objective. If the factsheet and prospectus use different categories, read their definitions before drawing conclusions. This helps you judge whether the fund’s actual exposure matches the role you expect it to play in your portfolio.
How Do I Read a Fund Fact Sheet?
Read a factsheet as a connected summary: the objective, strategy, risk profile and key fund details work together. Compare them with your goals and intended investment horizon.
Fund Objectives and Investment Strategy
A fund’s objective states what it aims to achieve, while its strategy explains how it invests to pursue that aim. Read both before weighing returns or risk. An objective focused on income differs from one focused on long-term growth, for example, so the assets and securities held may differ too.
Check whether the strategy describes active management, index tracking or another approach. Then consider whether its investment process and diversification fit the role you want the fund to play. A unit trust’s objective is not a promise of a particular result; it explains the decisions guiding the portfolio.
Investment Styles and Methodology
Investment style describes the characteristics or approach guiding a fund’s choices, while methodology explains how those choices are made. These details matter because funds with similar objectives may use different methods and hold different securities. Look for references to company size, valuation, income focus, sector selection or geographic scope.
Next, compare the stated method with the holdings and allocation tables. If a fund says it follows an index, check which index and how closely its holdings reflect it. For a discretionary strategy, note how the manager selects securities and whether the approach fits your expectations for volatility and diversification.
Risk Ratings, Volatility, and Time Horizon
A risk rating summarises a fund’s assessed risk, while volatility measures how widely its returns have varied. A Riskometer, where shown, can offer a visual summary of a scheme’s risk. Standard deviation describes volatility: an illustrative average return of 12% with standard deviation of 4% gives a range of 8% to 16%. A lower standard deviation means less historical variation, not no risk.
Compare these measures with the fund’s recommended horizon and your own plans. A long-term horizon of seven years or longer is recommended for goals such as retirement. A shorter timeframe may leave less room to manage market falls. Risk ratings and past volatility can inform your assessment, but neither predicts future returns.
NAV, Share Class, Currency, and Dealing Frequency
NAV, or net asset value per unit, is the fund’s value per unit. A share class identifies a particular version of the fund, which may differ in currency, income treatment or charges. The currency shows how that class is denominated, while dealing frequency indicates when investors can transact. Read these fields together to understand which class the figures describe.
For Singapore investors, a fund offered to an investor must be accompanied by a prospectus and Product Highlights Sheet (PHS). Read the PHS risk disclosures alongside the factsheet, then refer to the prospectus for fuller fund details. Together, these documents help put the fund’s stated risks, terms and objective in context before investing.
Fund name and geographical focus
A fund’s name is a clue, not a complete description of its investments. “Asia Growth,” for example, suggests a regional or growth focus, but doesn’t identify the countries, sectors or securities held. Use the name to frame your review, then assess the objective, country allocation and holdings in the factsheet. Detailed sections matter more than the label alone, especially when a title describes a broad region.
Compare the name with the stated investment objective and geographical focus. A fund described as Singapore-focused may invest in securities connected to Singapore, but the factsheet explains how that exposure is classified. Look for the country allocation and the methodology behind it. A company’s listing country, place of incorporation and sources of business activity can differ, so one label may not capture every economic exposure. Consider what the classification means for the fund’s actual portfolio.
Compare the country table with the fund’s asset allocation and top holdings. A Southeast Asia fund may hold assets across Singapore, Indonesia, Malaysia, the Philippines and Thailand, while concentrating in only some of those markets. Note the reporting date, as allocations can change when investments are bought or sold. Check whether the table lists countries individually or groups them into broader regions, since this affects how precisely you can assess exposure.
Geographical focus can shape the volatility an investor experiences. Markets differ in their industry mix, economic conditions and currency movements. If you’re in Singapore and reviewing a fund focused on Malaysia or Thailand, distinguish the fund’s base currency from the currencies linked to its underlying assets. These are related but not identical. Read the currency and country sections together to understand which exposures may influence returns and how they fit your existing investments.
Check whether the fund’s benchmark covers the same geography. A Singapore-focused fund and a Southeast Asia index are different references; comparing them without context may obscure the fund’s intended role. Also compare the name with the investment objective and prospectus. If “income” or “growth” appears in the title, use the strategy and distribution details to understand what the term means for the fund.
For a clear assessment, note the named region, largest country exposure, main sectors and any holdings that surprise you. Then consider whether those exposures align with your investment interests and existing portfolio. A name can help you identify a fund’s intended focus, but the country breakdown provides a more specific view of where its investments sit. Discuss how your investment exposures fit your wider financial plans.
Zenith Wealth: Retirement Planning
Zenith Wealth can help connect your fund research with a broader retirement plan. A factsheet shows a fund’s focus, risk and performance, but your retirement decision also depends on your goals, investment horizon and existing portfolio. Consider those factors together when assessing investments or other investment options.
Consider Retirement Planning when you want to understand how investment choices fit your intended retirement income and timeline. Zenith Wealth also offers Education Funding, Wealth Protection and Legacy Planning for other financial priorities. A financial planner can help you consider how these goals interact rather than viewing a single fund in isolation.
Bring your questions and discuss how your investment decisions fit your plans. Contact Zenith Wealth to start a conversation.
Put Your Fund Research Into a Wider Plan
Knowing how to read a fund factsheet can sharpen your questions, but choosing an investment is only one part of planning. Consider how a fund fits your financial priorities, the role it should play in your portfolio and which choices you may need to revisit as those priorities change.
Zenith Wealth Group offers Retirement Planning, Education Funding and Wealth Protection. These services can help connect investment decisions with goals beyond a single fund. A financial planner can help you consider those goals together and identify questions to explore before your next move.
Contact Zenith Wealth to discuss your options. Take the next step at your own pace, with a clearer view of how your investment choices fit your plans.
Frequently Asked Questions
What is a Factsheet?
A fund factsheet is a short document that gives investors a snapshot of a fund as at a stated date. It typically includes the fund’s objective, key details, holdings, risk information and performance. Use it for an initial review, not as a substitute for the prospectus, which provides fuller terms. For a Singapore fund offer, read the accompanying Product Highlights Sheet (PHS) and prospectus alongside the factsheet.
How to Analyze a Mutual Fund Factsheet?
Start by matching the fund’s stated aim with the role you need in your portfolio. Then compare its holdings, geographic exposure, risk indicators and fees with your own existing investments. Look for overlap: two funds with different names may hold some of the same securities. If you’re researching i12 investments, apply this same document-by-document approach rather than assuming one fund represents every investment option.
How to Use the Exit Load and Expense Ratio in a Factsheet?
An exit load is a charge that may apply when you redeem fund units, according to the terms shown. Check the trigger, timing and calculation method before investing, especially if you might need access to the money sooner. The expense ratio reflects ongoing fund operating costs. Compare it with similar funds and consider how recurring charges affect returns over your intended holding period.
What are the Key Ratios & Their Significance?
Ratios give context to performance and risk, but each answers a different question. The Sharpe ratio compares returns with risk taken, while beta indicates sensitivity to market movements. A beta of 1 suggests movement with the market; above 1 indicates greater volatility than the market. Compare ratios across similar funds and matching periods, rather than treating one figure as a complete assessment.
What information is included in a fund factsheet?
Fund factsheets commonly identify the fund and share class, objective, inception date, net asset value, currency, benchmark, holdings, allocation, risk measures and returns. Some also outline distributions and charges. For funds focused on Singapore, Indonesia, Malaysia, the Philippines or Thailand, pay attention to the stated country exposure rather than relying on the fund’s title. The reporting date tells you when the snapshot was prepared.
How to interpret a fund's investment objective and strategy?
The objective describes what the fund seeks to achieve, while the strategy explains its investment approach. Turn both into practical questions: does the fund seek income or growth, and which types of securities or markets does it use? Then compare those statements with the actual holdings. If the stated approach and portfolio seem misaligned, read the prospectus for fuller details before deciding whether the fund suits your needs.
How to read a fund factsheet's performance figures and benchmark comparison?
First identify whether each return is annualised or cumulative, then note the period and reporting date. Compare the fund with its stated benchmark over matching periods and on the same basis. Outperforming the benchmark in one period doesn’t establish a lasting pattern. Check whether income is included in the return figures, and distinguish actual performance from simulated or back-tested results.
How to compare fund fees, including management fees and expense ratios?
Compare fees for funds with similar objectives, share classes and investment approaches. A management fee pays for professional fund management; the expense ratio reflects operating costs charged to the fund. Check whether the stated figures include all relevant costs and whether other charges apply when buying, switching or redeeming units. Review the prospectus and PHS for fee terms, since one headline percentage may not show every cost.


